Histograms in photography are something all photographers eventually consider but few take the time to truly understand. While you may understand what a histogram is, you might not have taken much time putting it to use!
In that case: Welcome to this guide on how to read a histogram! We will also be exploring what a histogram looks like in various situations, from clipping to the perfect histogram.
Once you understand how to read a histogram, we’ll next go into how to use a histogram across most common photography situations. Also, we will examine some histogram photography examples that show how the histogram reading relates to the final image!
- What is a histogram in photography?
- How to read a histogram
- What is the perfect histogram?
- How to use the histogram on camera
- How to use the histogram in lightroom
- Histogram in photography examples

GET OUR FREE EBOOK TO
MASTER THE PHOTOGRAPHY BASICS
20 LESSONS AND 80+ PAGES WITH EXAMPLES, INFOGRAPHICS, TIPS, AND MORE!
What is a Histogram in Photography?
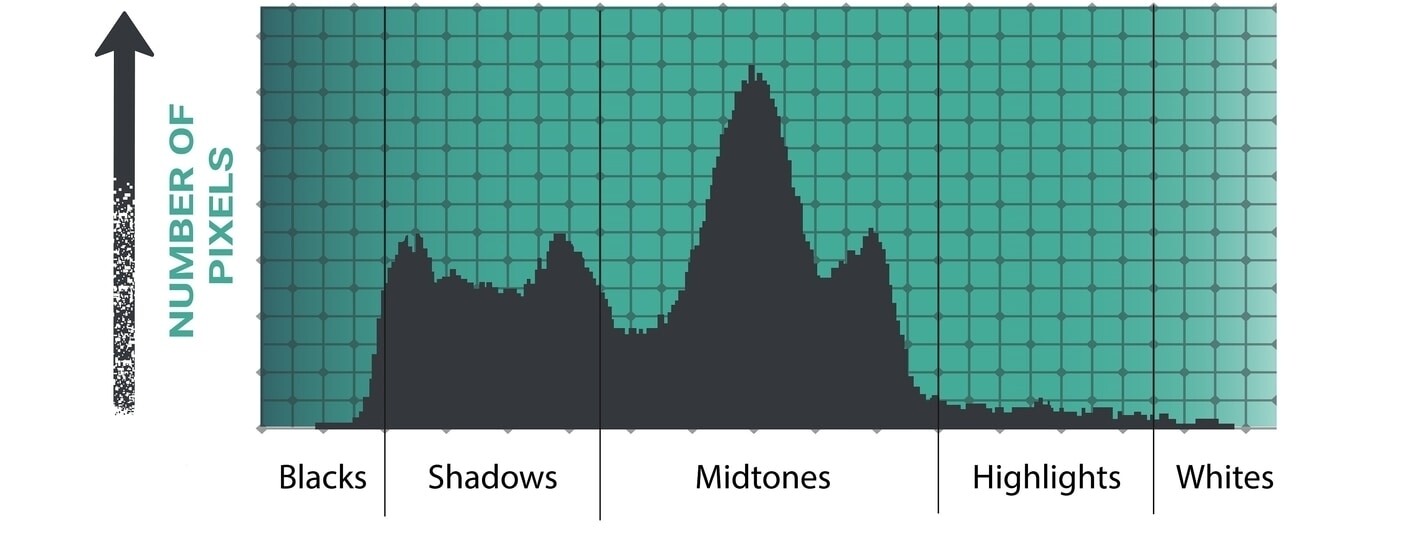
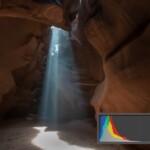
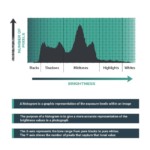
A histogram is simply a graphic representation of the exposure levels within an image. The purpose of a histogram is to give the photographer a more accurate representation of brightness values than even trained eyes can pick up on.

The parts of a histogram on the X-axis are the range from pure black to pure white values. On the vertical Y-axis we have the number of pixels that recorded this tonal value. Taken together we get a graphical representation of a histogram!
How to Read a Histogram Graph
Reading histograms in photography is essential but need not be a challenge because the graph is quite straightforward!
You just need to know how exposure in photography works and take a look at this infographic to better understand how to interpret a histogram!

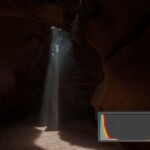
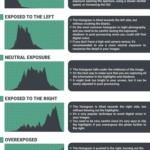
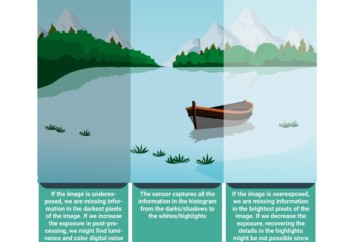
Underexposed Histogram
Looking at the first image in the comparison table, we can see how the histogram data is stacked to the left of the graph. This is a classic case of a strongly underexposed histogram.
The pixel brightness data at the far left represents true black tones captured by the sensor. In other words, there wasn’t enough light information for the camera to register anything other than darkness (0% brightness) in those sections of the image.

Underexposed Histogram
Another word for this lack of information is clipping, in this case, clipping of shadows. When trying to recover them in post-processing, you’ll usually end up with digital noise in your photographs.
To prevent a clipped picture, we need to increase incoming light by widening our lens aperture, decreasing the shutter speed, or raising the ISO value.
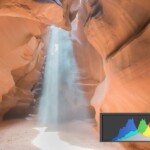
Histogram Exposed to the Left
Next, we have a histogram exposed to the left (ETTL). Notice how we still have a predominance of darker tones but without data piled to the far left that indicates black clipping (“crushing the shadows”).
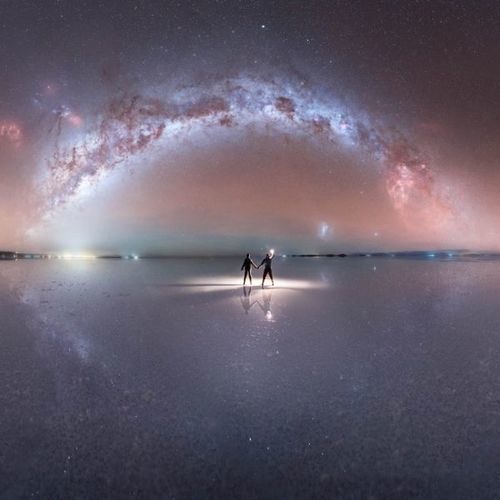
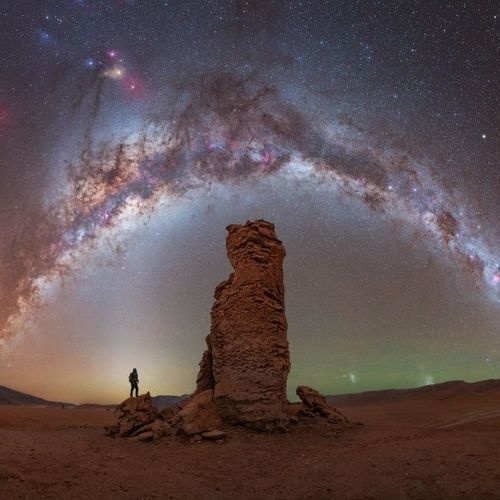
This sort of histogram is common in astrophotography scenes as even bright nighttime environments are still underexposed compared to ideal daytime conditions.

Histogram Exposed to the Left
Still, the shadows contain color information and are thus recoverable and flexible in post-processing. You’ll still need to be careful as digital noise can still appear when adjusted too strongly or with the wrong software.
I discuss several methods on reducing and eliminating this issue in my guide to Digital Noise Reduction!
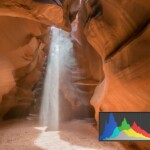
Properly Exposed Histogram
A properly exposed histogram is often called a perfect histogram because all of the pixels fall within the mid-tone range.

Properly Exposed Histogram
Midtones in photography mean there is no clipping in the highlights or shadows and we have the most flexibility in post-processing. We can darken or lighten our picture easily without visible loss in image quality.
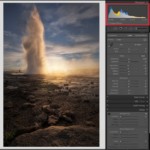
Histogram Exposed to the Right
Exposure to the right (ETTR) is a common technique used by photographers around the world. ETTR takes advantage of the fact that the further to the right you press the histogram, the greater the range of tonal values can be captured, so long as you don’t actually blow out the highlights.

Histogram Exposed to the Right
To do this technique, simply increase exposure beyond what the histogram and your eyes suggest is properly exposed with few to no pixels hitting the far right side of the graph.
Overexposed Histogram
An overexposed histogram is the reverse issue of an underexposed one. Too much incoming light information is overwhelming the pixels in this spot, resulting in pure 100% brightness being recorded.

Overexposed Histogram
Unlike clipped blacks, where the information is recovered with the issue of finding digital noise, clipped highlights are generally unrecoverable and this will result in white patches in your image.
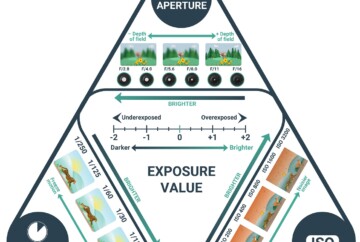
The best way to avoid an overexposed histogram is to understand exposure and how the exposure triangle works!
What Is the Perfect Histogram?
What should a good histogram look like? I mentioned earlier that a properly exposed histogram is often called a perfect or ideal histogram but I have to clarify this point a bit.
Since different camera systems require different approaches to histogram interpretation and adjustments, it’s worth mentioning that depending on the light conditions and the camera, ETTR or ETTL is better for capturing a Perfect Histogram.

For example, when studying a histogram for night photography, you should ideally expose to the left because you risk blowing out highlights given the extremes in brightness between astronomical objects and the night sky.
Many modern sensors are also especially flexible in post-processing; with anywhere from 2 to 4 stops of recoverable light information in the shadows.
You can check the difference between sensor sizes here.
When using high-end full-frame camera sensors, ETTL makes sense in order to perfectly preserve your highlight histogram information.
That being said, if you do ETTL and find digital noise being an issue, here is some of the best noise reduction software for correcting the issue!
However, ETTR is better for a wider range of cameras, especially lower-priced models like entry-level Canon or Nikon/Sony APS-C bodies. The image will look too bright on your camera screen, but you can easily balance your histogram to in post as long as you don’t clip the highlights.
To summarize: a perfect histogram is one where you can capture as much light information as possible without clipped highlights or shadows, and this depends on the light conditions, your subject, and your gear!
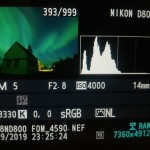
How to Use the Histogram On Camera
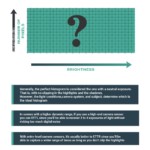
Remember that relying on the LCD screen to gauge exposure is a poor practice because your eyes are easily fooled, especially when it’s dark out. Histogram interpretation is best because the LCD image will look incredibly bright compared to your surroundings.
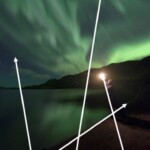
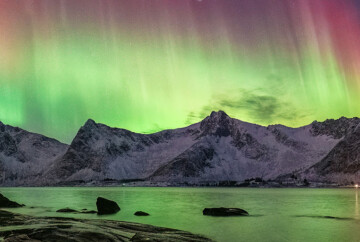
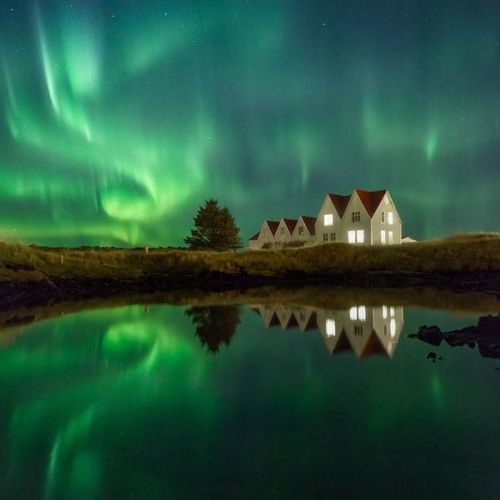
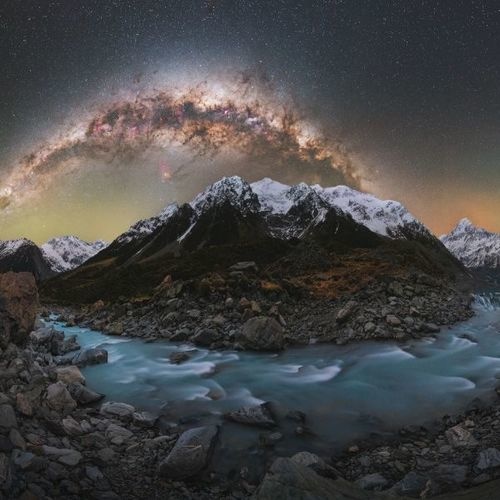
When photographing the Milky Way and other night events like Northern Lights, it’s easy to get fixated on the LCD image. However, when you return home you may find that your final image is significantly underexposed unless you check the histogram.
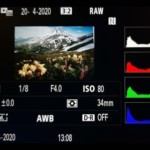
Fortunately, the histogram on your digital camera is usually easy to find! When not immediately visible on the LCD or viewfinder display, it can be activated through the menu system or one of the display buttons on your camera.

How to Use the Histogram On Camera
Besides, finding the histogram in mirrorless cameras is even easier; you can see it through your optical viewfinder even before shooting!
How to Use the Histogram in Lightroom
Reading a histogram in Lightroom or Photoshop helps guide you through the editing process by giving you a clear picture of what adjustments can and should be made.
If you find you’re blowing the histogram shadows and highlights, Adobe Lightroom also has some of the most powerful tools for mitigating these issues! For instance, Lightroom can show clipping via Clipping Warnings that display Lightroom histogram clipping in red.

How to Use the Histogram in Lightroom
The histogram in Lightroom can be found in the Library Module, where you can see the results of edits in the Quick Development panel. Alternatively, the Develop Module also has a histogram that displays how post-processing changes affect the final histogram in Lightroom.
Benefits of Understanding Photography Histograms
Learning how to read and use histograms is essential because this simple graph contains a wealth of information that influences how we approach each scene. A histogram’s captured information grants us:
- A greater understanding of how exposure relates to the final image
- Histograms show clipping tones when your LCD view can trick your eye
- Analyzing a histogram makes it easier to get exposure right in-camera
- Histograms in night photography allow for finely tuned ETTL technique
- Using the histogram in post-processing will point at which adjustments we should apply
If you find you still feel some confusion around how to change the shape of a histogram, my Exposure Triangle in Photography Guide breaks down each aspect of controlling light exposure!
Histogram Examples in Photography
Here are some histogram side by side examples to further your understanding of how to read and understand your histogram!
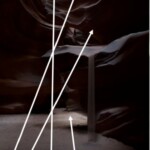
Underexposed Histogram Example
In this image, you’ll notice that the blacks are clipped to the point of being crushed; adjusting these in post-processing would result in strong digital noise.

Underexposed Histogram Example
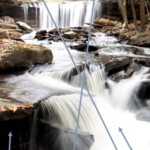
Exposed to the left histogram example
While exposed to the left this image has recoverable information in the shadows and is more flexible to work with than the underexposed example.

Exposed to the left histogram example
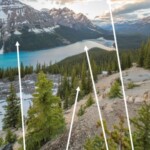
Properly exposed histogram example
The histogram of this image shows a perfect range of mid-tones and no clipping of either highlights or shadows!

Properly exposed histogram example
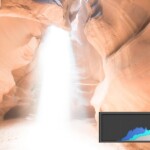
Exposed to the right histogram example
This is the sort of image most photographers aim for when using ETTR; by recovering the highlights the final image will have improved dynamic range, depending on your camera!

Exposed to the right histogram example
Overexposed Histogram Example
An overexposed image like this one has clipped highlights where pixels registered 100% brightness.

Overexposed Histogram Example
RGB Histogram Example
Unlike a regular histogram, which includes all colors, an RGB Histogram displays exposure information for each color channel.

RGB Histogram Example
Histogram in Photography F.A.Q
Conclusion
If you’ve made it this far, you will have a solid understanding of what a histogram is and how a histogram works. We’ve also touched on the various interpretations of how a histogram should look, including exposure to the left, right, and the ideal histogram.
If you’re still unclear on why using a histogram is in your best interests, I recommend taking some test shots with visibly off exposure. Then, compare your in-camera or Lightroom histogram readings with the notes presented here to better understand the histogram!
If you have any more questions on how to read a histogram in photography, feel free to leave a comment! Lastly, don’t forget to download our beginner’s PDF guide if you want to learn more photography.
Happy trails!


Thanks a lot for writing this post. I’ve taken some over exposed shots and realised only after checking them in my laptop.
I would use histograms from now on. Loved the article and the graphics ❤️
Thanks so much Vignan 🙂 glad it helps!
thanks for the article Dan. i learnt a lot today about histogram as its very important to understand histogram for color grading . could you put some light on, how to treat or read each color i.e. RGB anf yellow , magenta and cyan while do coloring or adjusting various functions of lightroom. i downloaded your free e book. hope i will some more from there as well. thanks
Thanks, Rajesh! Happy to see thar our Histogram article helped!
Thanks for finally writing about > How to read a histogram?
Understanding histograms in photography great auto parts
Thanks Jennie!
I’m glad to see that our histogram article helped!
Hi Dan,
3 questions. You said “ETTR is better for a wider range of cameras, especially lower-priced models like entry-level Canon or Nikon/Sony APS-C bodies.” – could you please explain exactly why ETTR is good for entry level cameras?
And how does ETTR provide better dynamic range? Looking at the pics, the ETTL pics seem to have more dynamic range than ETTR pics.
Lastly, would you apply the same tips above for video as well? otherwise how would we expose differently via histogram for video? Thanks!
kar,
Entry-level cameras don’t have the low-light capabilities of more advanced cameras, and therefore the ETTR technique usually provides better results.
ETTR is more optimal since the photons in the sensor are capturing more light and a higher dynamic range in the image.
I do some filming but I’m not an expert in videography, so I can’t reply your question on filming, sorry!
Hope this helps,
Dan
You say the y-axis is the number of pixels. A sensor has a number of pixels (heigth x width). Does this mean that the surface of the histogram is equal to the total number of sensor pixels? Si if 100% black (100% clipping to left), is de spike height at the left equal to the number of sensor pixels?
Mike,
The surface of the histogram is not equal to the number of sensor pixels, but the shape of the histogram is equal to this number of pixels. following this, if the histogram is clipping to the left (if for instance you take a picture with the lens cap on, there will be a spike representing the total number of mpx with no light/data information.
Take the histogram as a visual representation of the distribution of the total number of pixels that you have, regardless of the actual number of pixels of the camera sensor. Hope this make sense and helps!
Best,
Dan